Dec 03, 2019
Adding SaaS Monitoring System to Your Project
The monitoring system is a very necessary tool for early detection and rapid solutions, and in certain cases to avoid and prevent disruption of service, and therefore the loss of material and image nature. Today we will analyze in detail how and using what tools we add monitoring to our projects.
Jan 08, 2020
Development
What is SaaS Monitoring
SaaS monitoring is a critical aspect of ensuring the optimal performance, availability, and reliability of cloud-based applications. It involves the continuous tracking and analysis of various metrics and key performance indicators (KPIs) associated with SaaS platforms. The goal is to proactively identify and address potential issues that may impact the user experience or the functionality of the software.
SaaS monitoring encompasses a range of activities, including real-time performance monitoring, log analysis, error tracking, and resource utilization tracking. It provides insights into the health of the SaaS infrastructure, enabling organizations to detect anomalies and troubleshoot issues promptly. This proactive approach helps prevent downtime, enhance user satisfaction, and ultimately maintain the overall efficiency of the SaaS applications.
Why is SaaS Monitoring Important?
SaaS Monitoring Types
We can distinguish (conditionally) the main areas of monitoring:
- Resource monitoring
- Application Monitoring
- Application business logic monitoring
Resource Monitoring
It is critically important to keep under control the state of the CPU, RAM, disk space since the lack of these resources is guaranteed to lead to application inoperability. It is also important to keep under control and monitor the dynamics of resource consumption in order to be able to prevent problems.
Also, monitoring the dynamics of resource consumption will help to more accurately select the quantitative characteristics of resources, and, accordingly, get the best efficiency.
Application Monitoring
It is important to understand what is monitored and why, what metrics are especially important for understanding the application’s performance and what you need to configure alerts for (e.g.: the number of requests per second, the response time of the service, the number of successful and unsuccessful requests, database queries).
Application Business Logic Monitoring
Monitoring business logic helps to understand if there are problems in the application’s flow, and also makes it possible to collect statistics that can be used to analyze the operation of the service.
The roll-out of the monitoring system on internal resources and the reason why this was the best solution
This approach to configuring monitoring systems can be used, for example, when a project is already deployed on the company's internal resources or on the virtual machines of a cloud provider, the monitoring solution of which was not suitable for one reason or another.
To deploy a monitoring system it is necessary: to select monitoring tools (in our case it is Zabbix, Prometheus + Grafana, ELK stack), configure the server (virtual machine) and configure this very software (monitoring tools).
Zabbix
This is one of the open sources for monitoring. Reasons for choosing:
-
Moderate resource consumption
- Extensive documentation, quick setup
- Flexible template system
We use Zabbix to monitor machine resources and database status. Check the examples below.
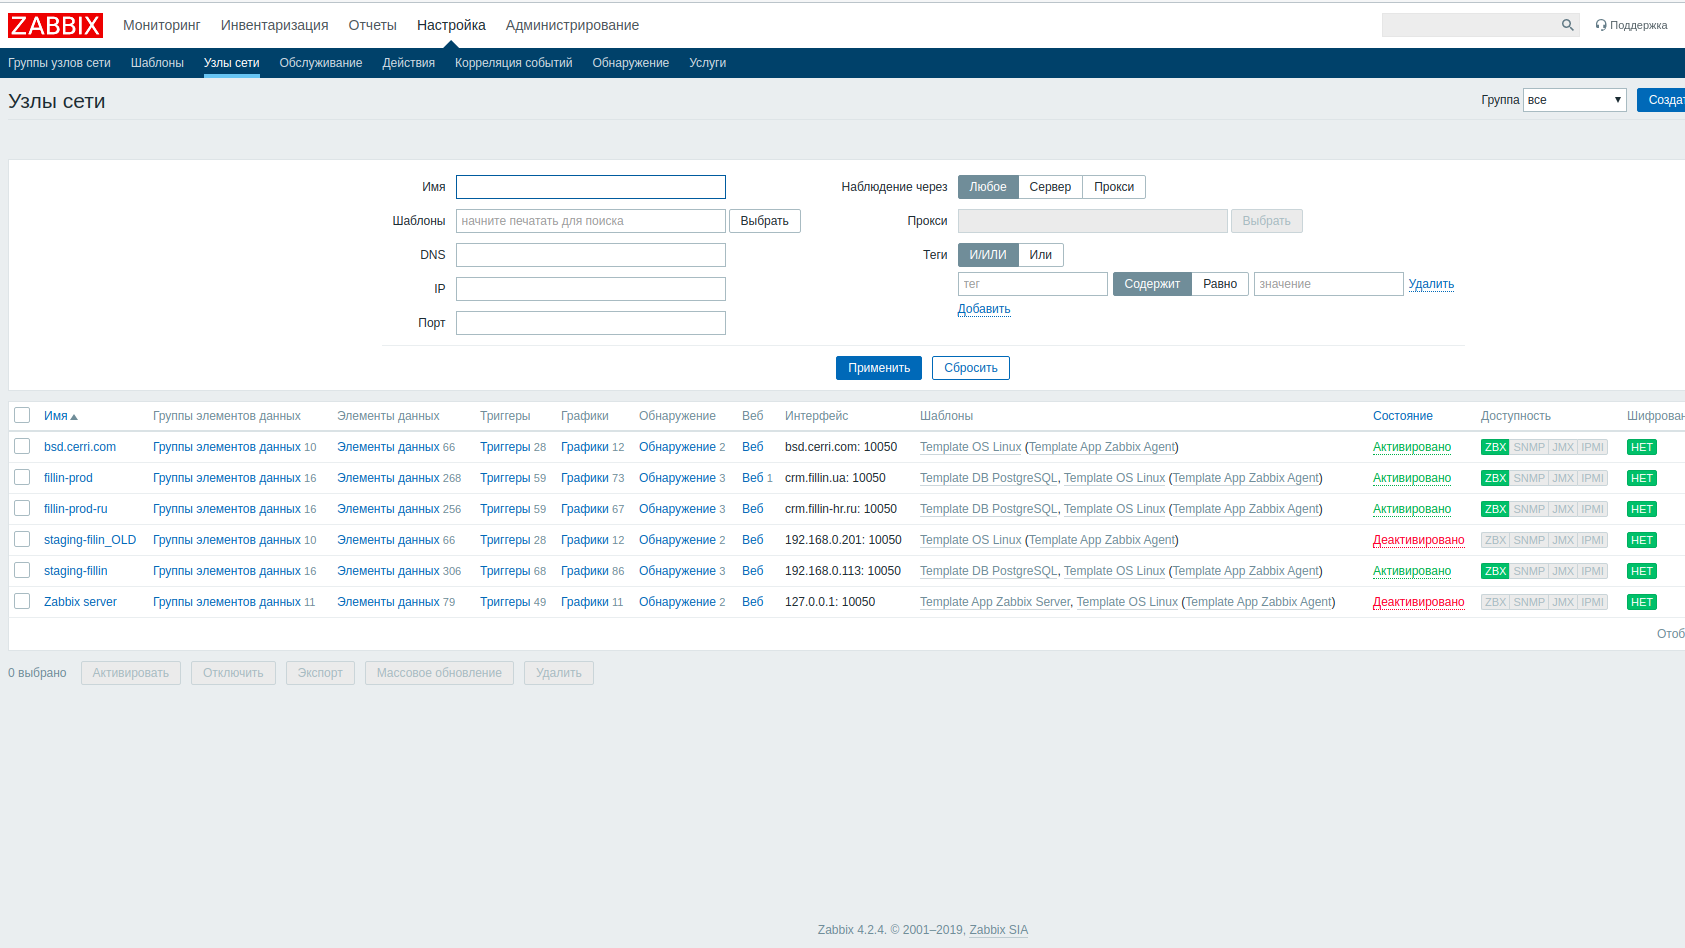
Host List
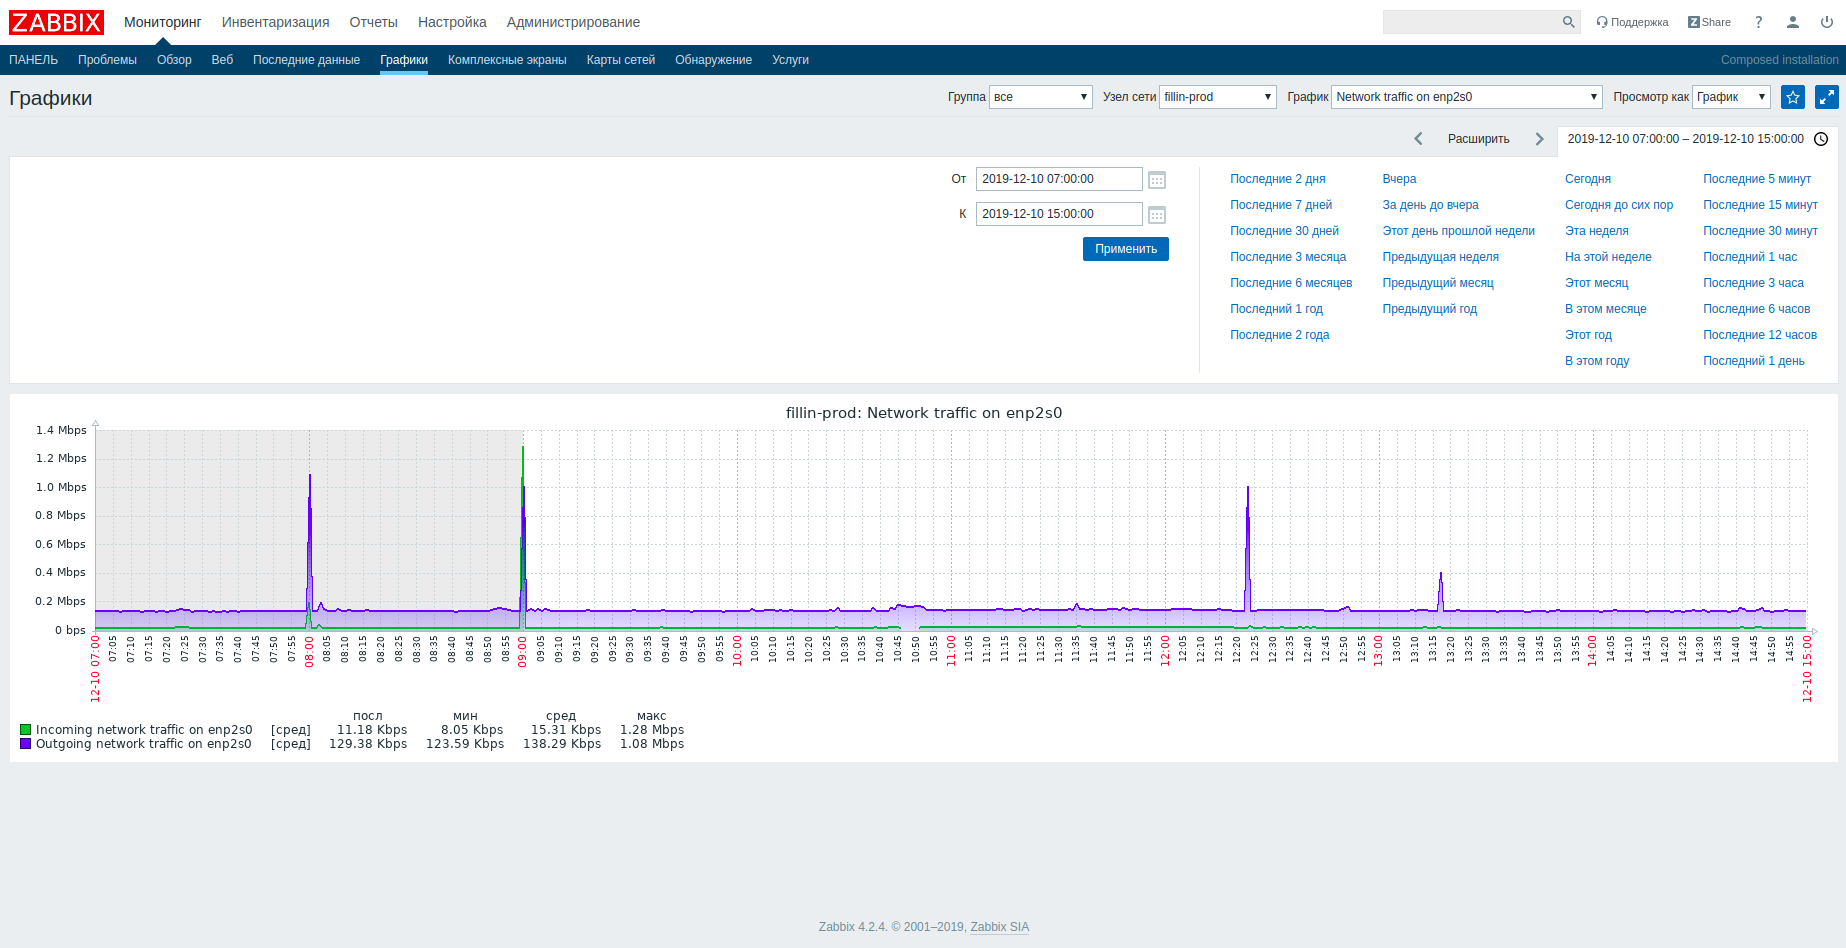
Example inbound/outbound traffic graph
CPU load graph example
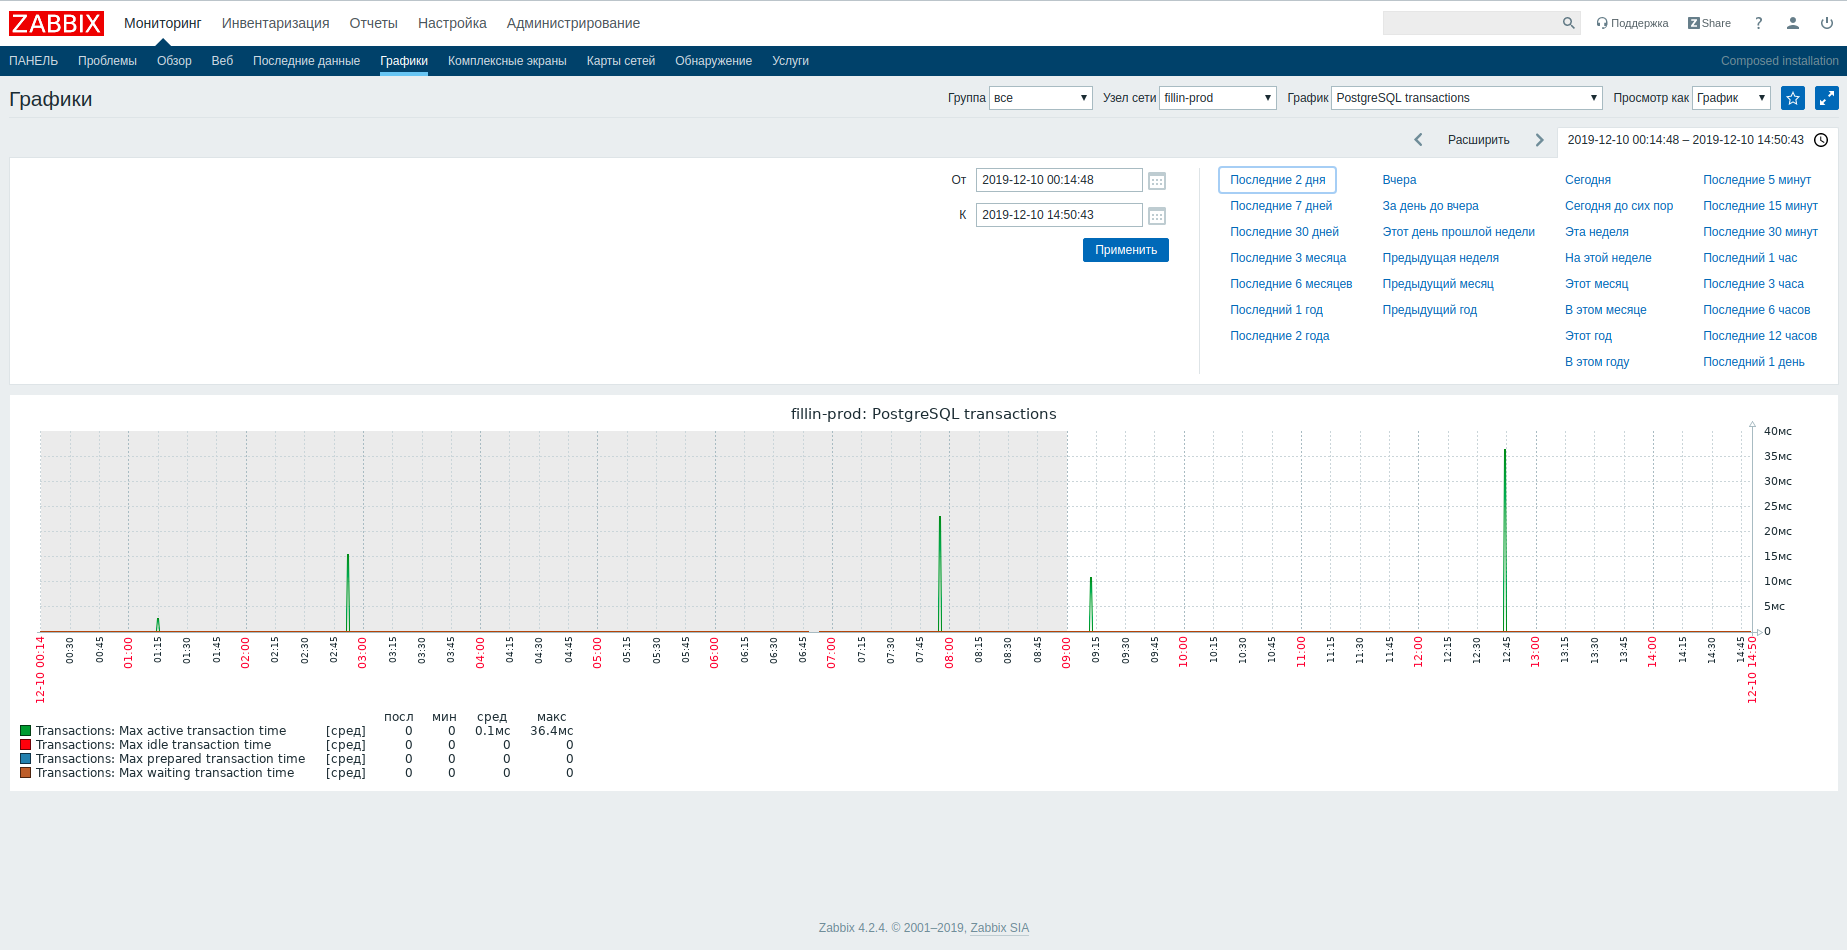
Example transaction database chart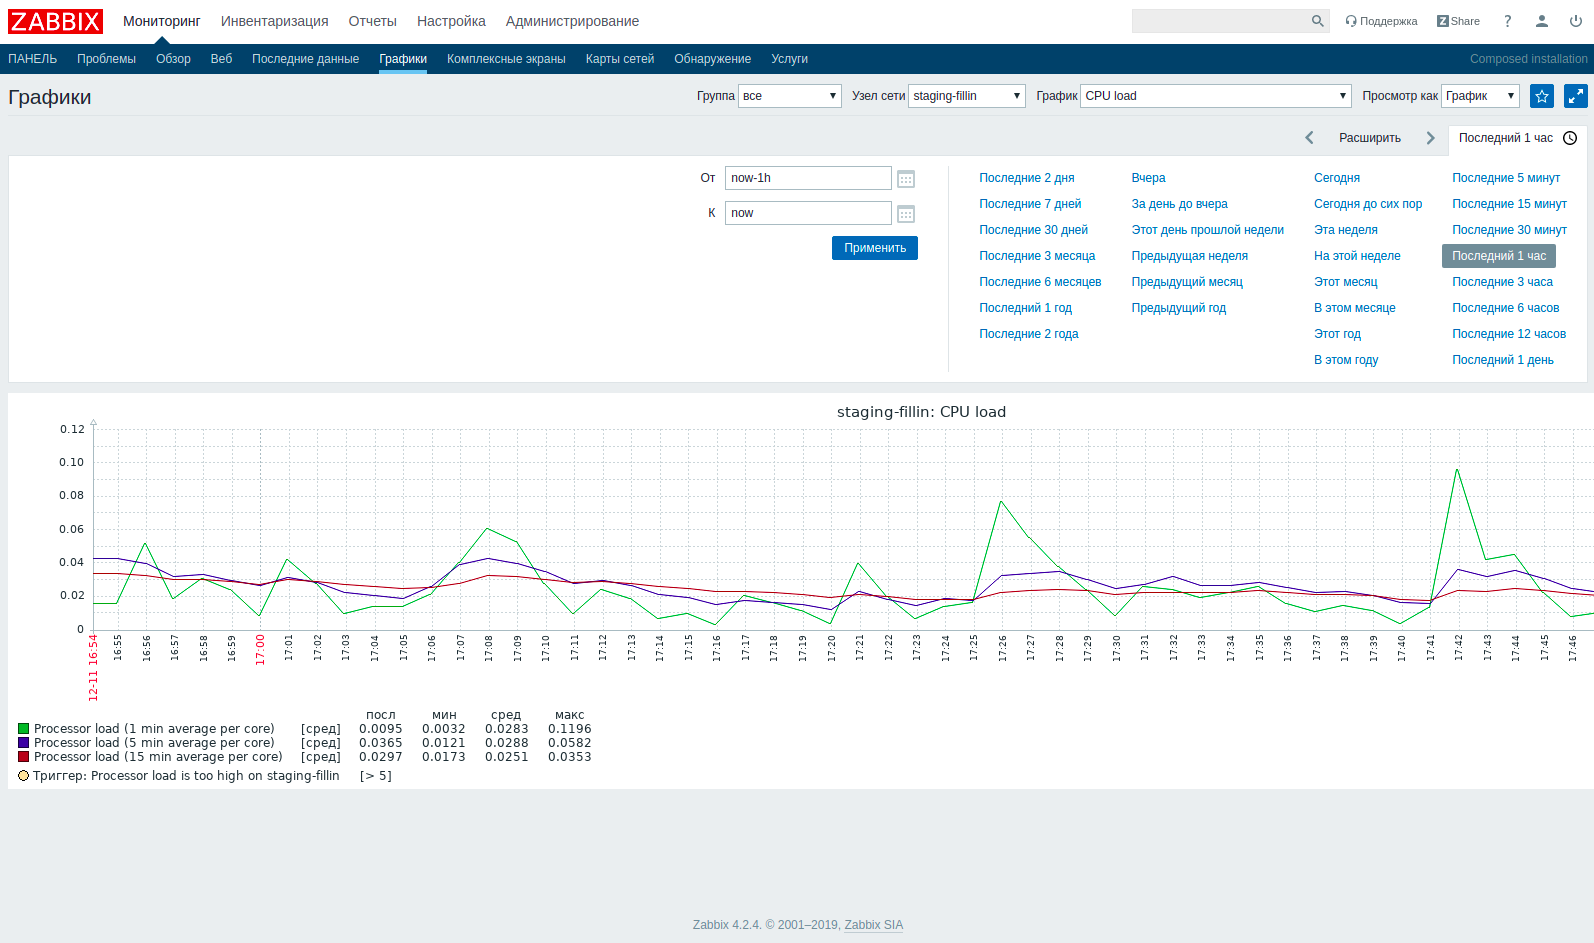
Prometheus
Prometheus is a convenient monitoring tool but requires a more thorough approach to installing and configuring components.
Prometheus monitoring system components:
- Server Prometheus: collects and stores in its own database certain objects (metrics) of the target monitoring object. Allows using the PromQL query language to search and visualize the necessary metrics. Allows the user to monitor both the application (for this application must be able to generate a list of metrics), and third-party systems (the status of servers, databases, and so on) to obtain metrics which require “exporters” - applications that accumulate metrics and export them in an understandable Server Prometheus format. At the moment there are already a lot of exporters for existing technologies (exporters for monitoring machines, databases, load balancers and so on).
Check the examples below.
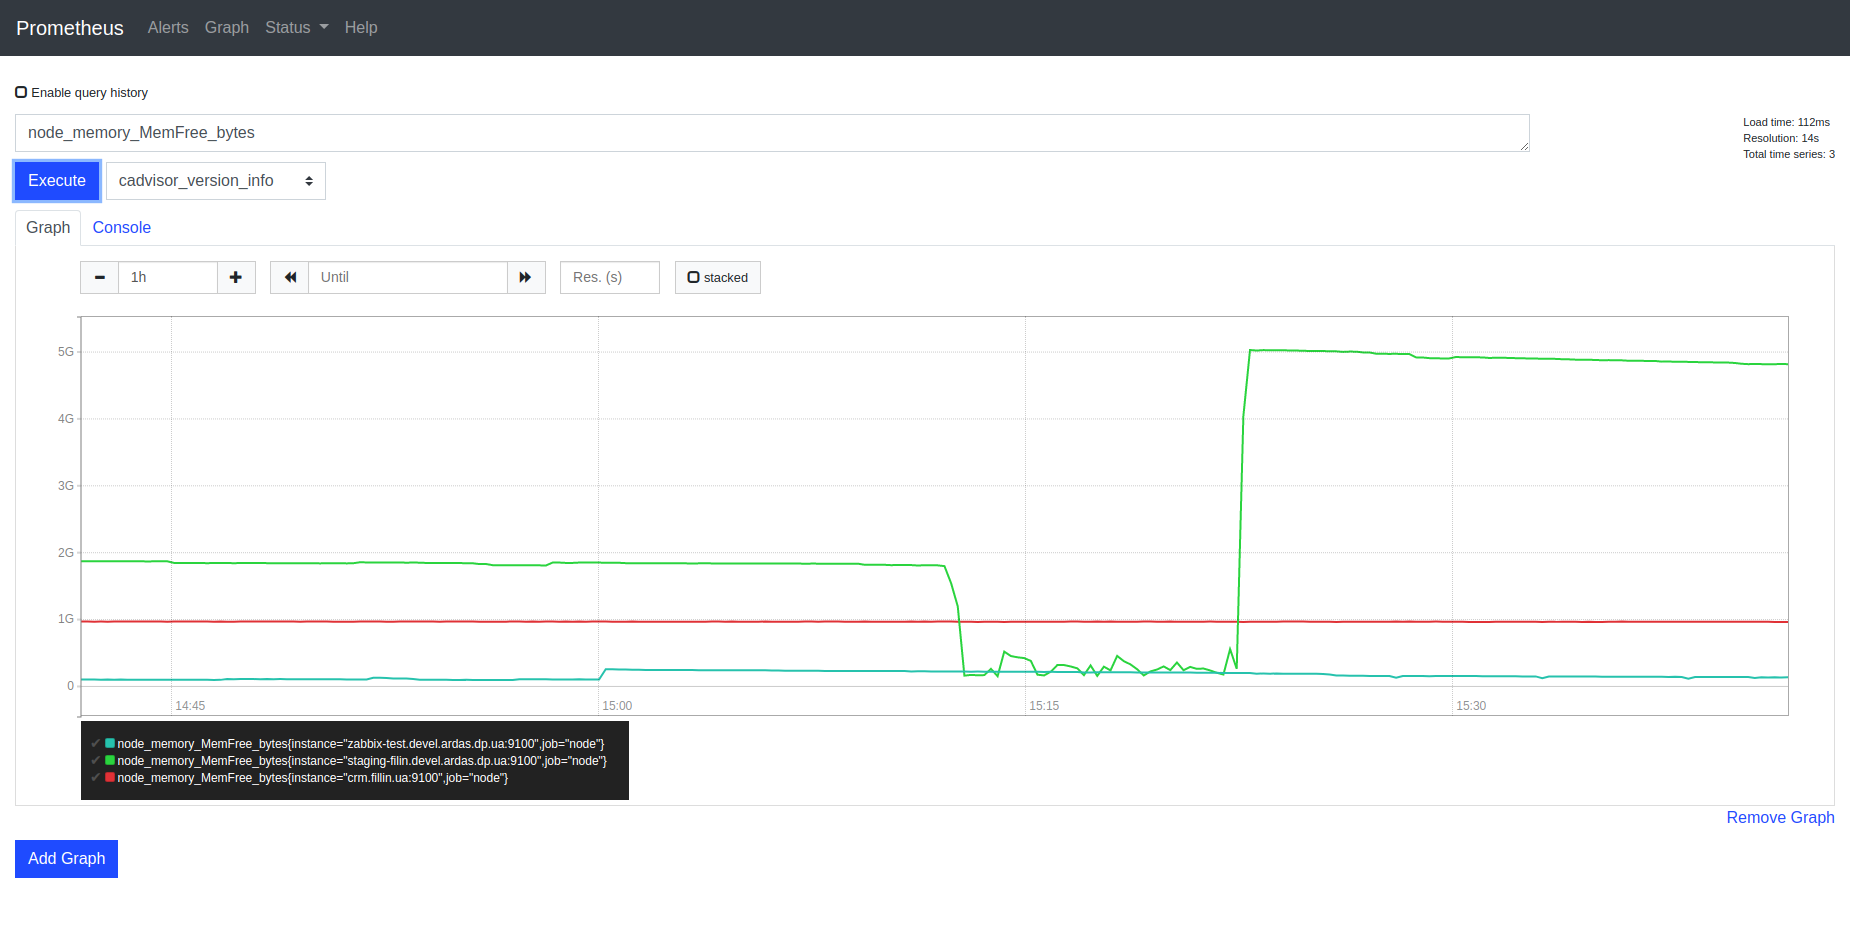
Request and visualization example on Server Prometheus
- Grafana: The component that can be used to build convenient visualizations.
Check the examples below.
Visualization of resources used (for each service)
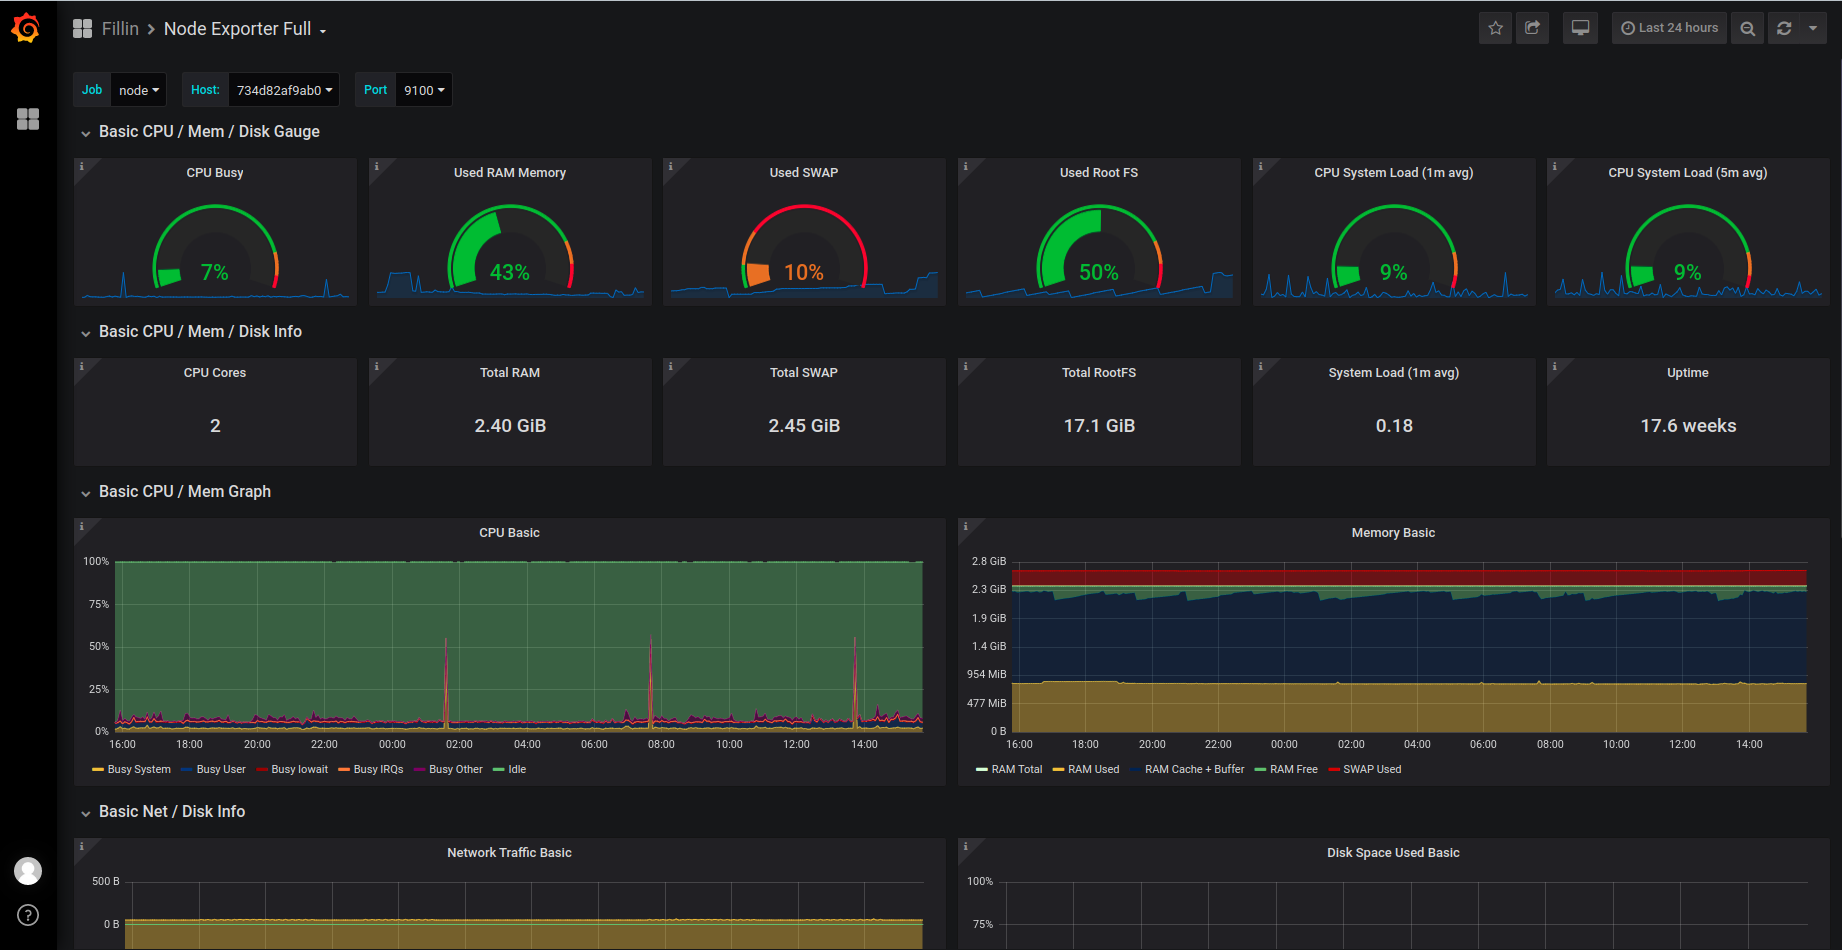
System resource utilization visualization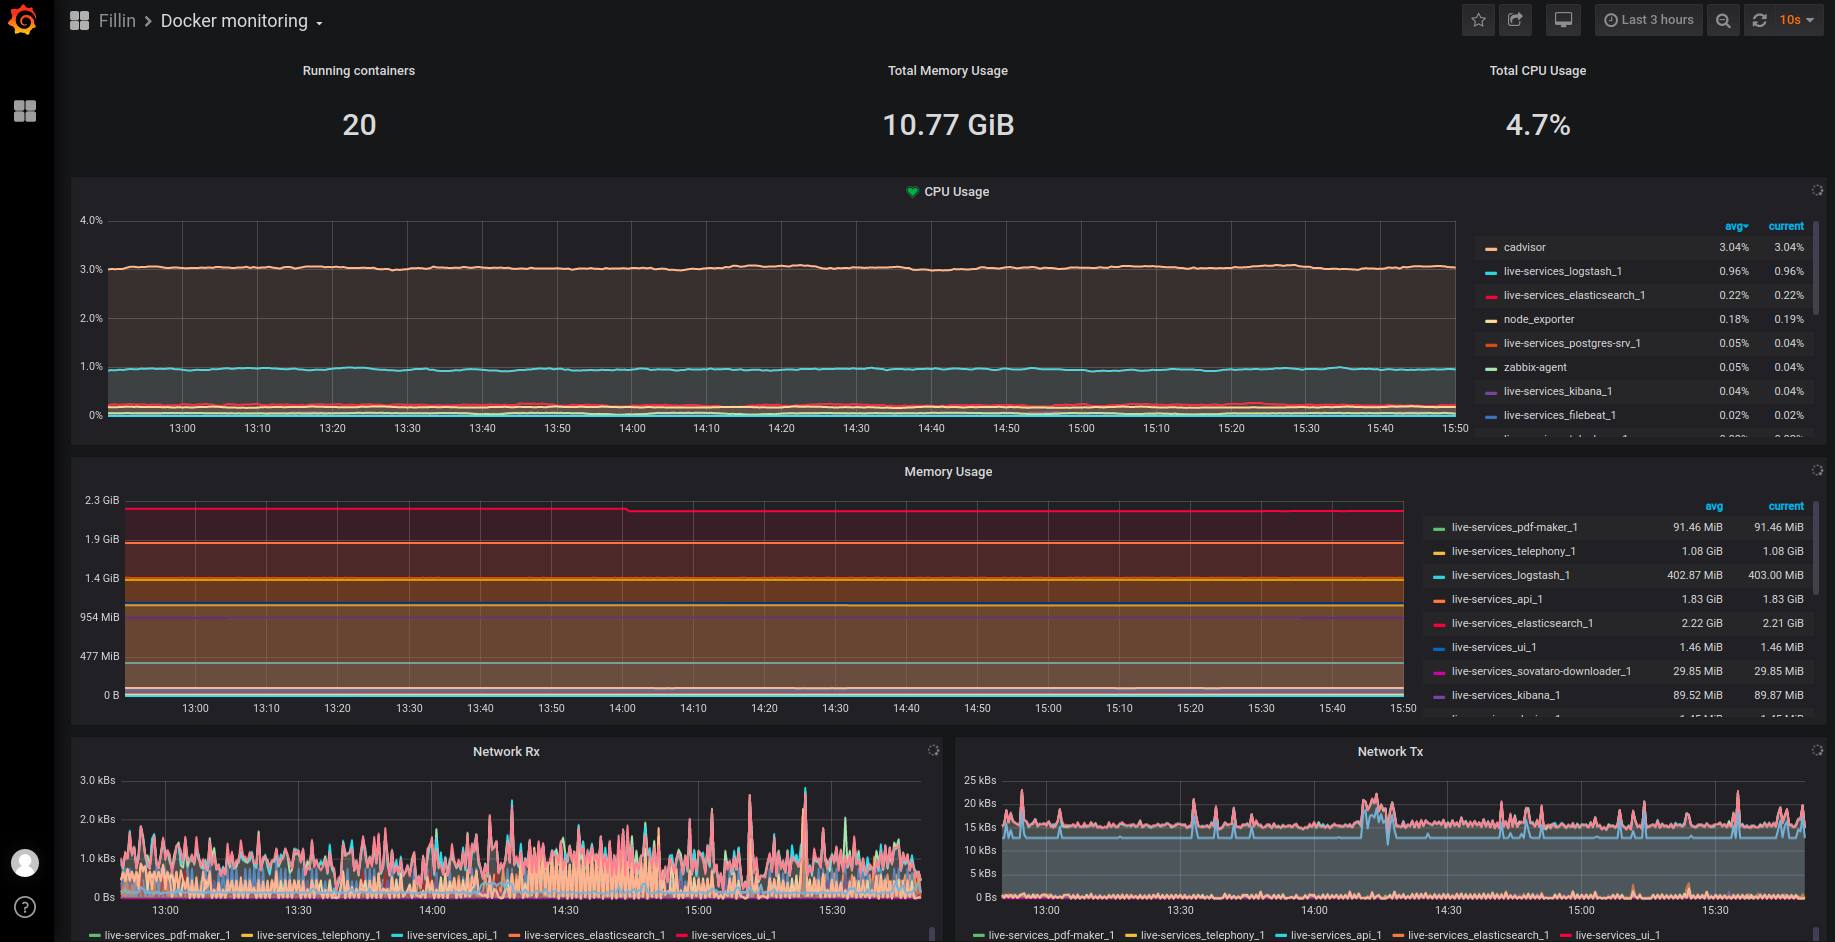
- Prometheus Alertmanager is a component that allows you to flexibly configure alerts and send alerts via email, Telegram, Slack and others. Alerts are configured in the configuration file (YAML) and define a set of rules for metrics.
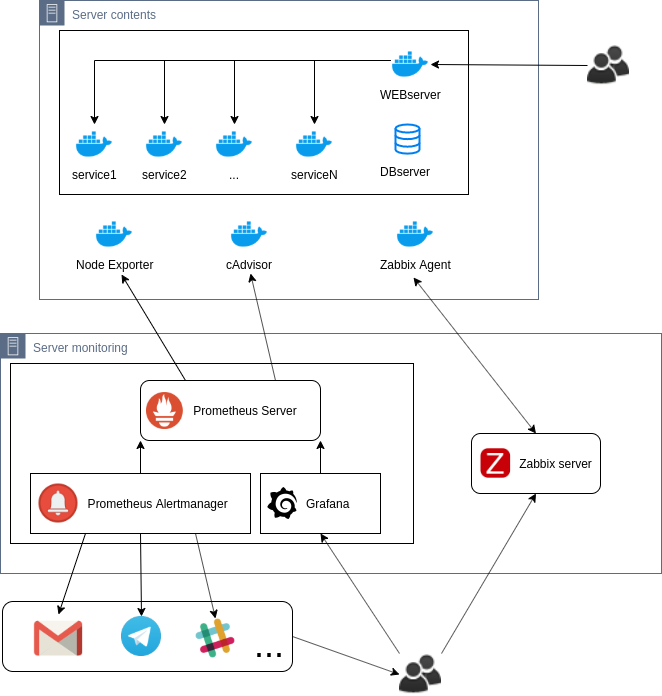
Project Diagram with Monitoring Services Enabled
How to install and prepare scripts for recovery disaster
To install monitoring systems, it is best to use official documentation:
Install Zabbix
Install Prometheus
After installation and configuration, if you did not use configuration management tools (Ansible, puppet ..), it would be better to make a system cast or a script to automatically deploy all elements of monitoring systems in case of emergency recovery.
In conclusion, project monitoring is important in making the project management plan work to meet your project objectives. It is a part of the project and project management, not an addition to it. Given the data about the team, the project and the prediction of overdue, project managers can customize the project plan and address issues before they happen. With project monitoring, you can identify the most efficient way to manage your resources and continually assess your project status, so you can ensure your project success. We hope that our case came in handy to you, though if you have no time to work on adding a project monitoring system, our dedicated development team is ready to assist!
Best regards,
Ardas Team
Table of content
See also
Nov 18, 2019